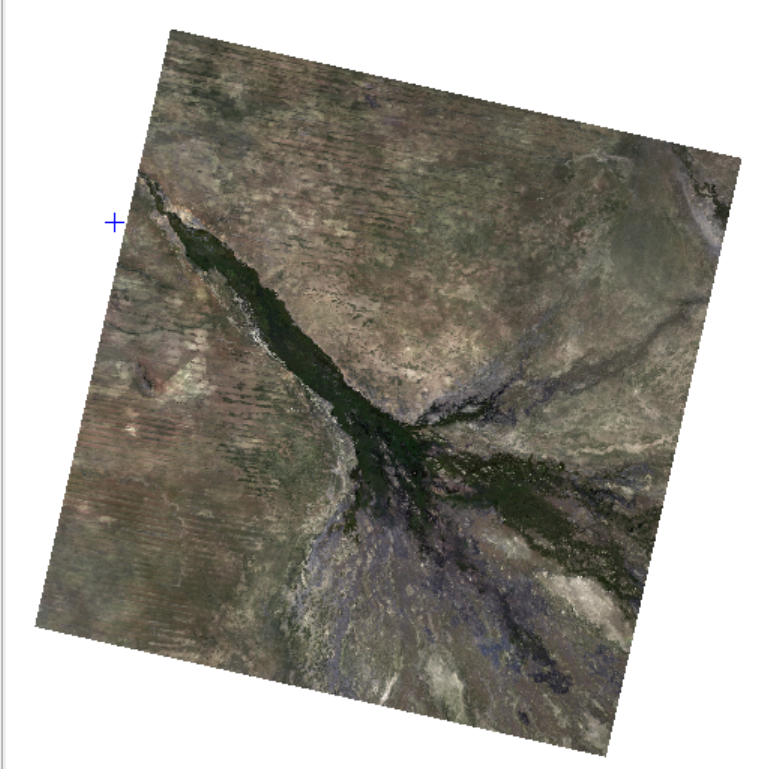
Image 1: Okavango Delta May 25th, 2019
Data Identification and Source Context
For my research on the Okavango Delta, I am using a Landsat 8 Collection 2 Level-2 dataset from the U.S. Geological Survey. These files are described as "Analysis Ready" because they have been cleaned up to remove visual interference from the sky. While standard satellite photos simply capture light as it looks from space, these updated versions have been adjusted to show the true heat and colour of the Earth's surface. This is vital for my work because it ensures the appearance of plants and water in Botswana is accurate and not blurred by dust, haze, or moisture in the air.
Each image has a unique ID code that reveals exactly when and how it was made. This particular data was collected on May 25, 2019, using advanced tools that measure both visible light and heat. Because the image is labelled "Tier 1," it is guaranteed to be high quality and perfectly matched with maps of the ground. By using the latest version of this data, I can be sure the locations and temperatures are as precise as possible. Using these official records also makes my study more reliable, as other researchers can easily find and verify the same information.
| Metadata Feild | Value | Interpretation |
|---|---|---|
| Spacecraft ID | Landsat_8 | Confirm the platform launched in 2013, carrying OLI and TIRS sensors. |
| Processing Level | L2P | Level-2 Science Product; includes atmospheric correction for SR and ST. |
| WRS Path/Row | 175/ 73 | The specific orbital coordinate over the Okavango Delta, Botswana. |
| Collection Number | 02 | The most recent data collection, offering improved geometric and radiometric calibration |
| Tier Category | T1 | Tier 1; meets the highest USGS standards for geometric and radiometry quality |
Spectral Capabilities of the OLI and TIRS Sensors
The following table describes the bands included in this dataset that will be used for the Okavango analysis.
| Sensor | Band Number | Description | Application in Okavango Delta |
|---|---|---|---|
| OLI | 1-4 | Visible (Coastal, B, G, R) | Mapping water depth and submerged vegetation |
| OLI | 5 | Near - Infrared (NIR) | Distinguishing land from water and assessing plant health. |
| OLI | 6-7 | Shortwave IR (SWIR) | Identifying soil moisture and burnt areas. |
| TIRS | 10 | Thermal Infrared | Measuring surface temperature and evapotranspiration. |
Geographic Location and Image Dimensions
The geographic location of this study is centred over the Okavango Delta in Botswana, specifically identified by the World Reference System (WRS-2) as Path 175, Row 73. This area is an inland delta known for its complex network of channels and lagoons. To ensure the image sits correctly on a map, the metadata specifies the use of the UTM (Universal Transverse Mercator) Projection, Zone 34 South, based on the WGS84 datum. This is the standard coordinate system for this region, providing a reliable method to measure distances and areas within the wetland with minimal distortion.
The size and scale of the data are defined by its "grid cell size" and "dimensions." Every pixel in this image represents a 30-meter by 30-meter area on the ground. This "spatial resolution" is ideal for mapping the delta because it is detailed enough to see large river channels and patches of forest, yet covers a massive total area. The image itself is a large grid made up of 7,791 rows (lines) and 7,691 columns (samples). When you multiply these together, the data contains nearly 60 million individual measurement points, providing a very thorough look at the landscape.
| Image Corner | Latitude | Longitude | UTM Northing (Y) | UTM Easting (X) |
|---|---|---|---|---|
| Upper Left | -17.74 | 21.38 | -1,961,400 | 540,00 |
| Upper Right | -17.72 | 23.55 | -1,961,400 | 770,700 |
| Lower Left | -19.85 | 21.38 | -2,195,100 | 540,00 |
| Lower Right | -19.83 | 23.58 | -2,195,100 |
Temporal Context and Environmental Timing
The timing of this satellite pass is the most important factor for studying the Okavango Delta. According to the metadata, the image was acquired on May 25, 2019, at exactly 08:30 AM local solar time. In the context of the Okavango’s unique hydrological cycle, this date represents a critical transition period. While most of Southern Africa is entering its dry winter season in May, the delta is just beginning to receive the "pulse" of floodwaters that travelled months from the Angolan highlands.
Choosing an image from late May allows me to observe the "greening up" of the delta. As the water fills the channels, the surrounding vegetation reacts, which is clearly visible in the spectral data. Furthermore, the metadata reports a Cloud Cover of 0.00%. This is incredibly rare for tropical or subtropical wetlands and is a major advantage for this project. It means there is no interference from clouds or shadows, giving me a "perfect" view of the water's edge and the health of the reeds and grasses without any missing data points. Unfortunately, the year 2019 suffered a major drought even during the rainy season, seriously affecting the amount of water received from the Angolan Highlands.
Spectral and Radiometric Characteristics
The Landsat 8 platform carries two instruments: the Operational Land Imager (OLI) and the Thermal Infrared Sensor (TIRS). Together, they provide 11 bands of data, but this Level-2 product focuses on the 7 reflective bands and 1 thermal band that are most useful for environmental science. The data is stored in a 16-bit Unsigned Integer (UINT16) format. This means that instead of just having 256 levels of gray (like a standard 8-bit photo), each pixel can have a value ranging from 0 to 65,535. This "radiometric resolution" is crucial for the Okavango Delta because it allows us to see very subtle differences in water depth or the moisture content of the soil that would otherwise be invisible.
U.S. Geological Survey. (2019). Landsat 8 Level 2 Surface Reflectance and Surface Temperature Science Product for Scene LC08_L2SP_175073_20190525_20200828_02_T1. EarthExplorer; U.S. Geological Survey. https://doi.org/10.5066/P9OGBGM6
Image 2: Okavango Delta, May 19th, 2025

Geographic Location & Image Dimensions
For this part of my project, I am using a Landsat 9 Collection 2 Level-2 dataset. Even though this image shows the same part of the Okavango Delta (Path 175, Row 73) as my other maps, it comes from the newest Landsat satellite available. Just like my first image, this is "Analysis Ready Data." This means the USGS already fixed the image using the LaSRC algorithm to remove any blur or interference from the air. This is important because it makes sure the colours and brightness I see in Focus show the real Surface Reflectance of the wetlands on May 17, 2025, instead of being messed up by the atmosphere.
You can find the exact details for this record in the product ID: LC09_L2SP_175073_20250517_20250519_02_T1. This ID shows the data was caught by the OLI_TIRS sensors on the Landsat 9 satellite. This image is also labelled as Tier 1 (T1). That means it was made using the best possible standards, so I can easily compare it pixel-by-pixel to the older data from Landsat 5 and Landsat 8.
U.S. Geological Survey (2025). Landsat 9 Collection 2 Level-2 Surface Reflectance and Surface Temperature for Path 175, Row 73 (Acquired May 17, 2025). [Data set]. https://doi.org/10.5066/P9OGBGM6
| Dimension | Landsat 9 (2025) | Interpretation |
|---|---|---|
| Reflective Lines | 7,791 | Number of horizontal rows |
| Reflective Samples | 7,681 | Number of vertical columns. |
| Cell Size | 30.00 | Each pixel represents a 30m x 30m area. |
| Orientation | North_Up | The image is aligned with true North. |
Temporal Context & Cloud Analysis
Choosing May 17, 2025, for this image gives me a great look at the delta compared to my older data. By mid-May, the local rainy season has usually ended, and the big flood from the Angolan highlands is just starting to flow into the delta's channels. Since this was taken by the new Landsat 9 satellite, the metadata confirms I am using the OLI-2 and TIRS-2 sensors. These tools provide really sharp data, making it much easier to tell the difference between deep water, muddy soil, and healthy green plants.
The Cloud Cover for this day is exactly 0.00%, which is the best-case scenario for this kind of work. This means no clouds or shadows are blocking the view anywhere in the scene. With older images, I often had to use "masking" to hide parts of the map that were covered by clouds, but this image is clear. When I bring this into Focus, I can run my calculations across the whole area without worrying about errors. I know that every pixel shows the real Surface Reflectance of the ground as it was that day, without any atmosphere or haze messing up the results.
Spectral Bands and Radiometric Detail (Landsat 5)
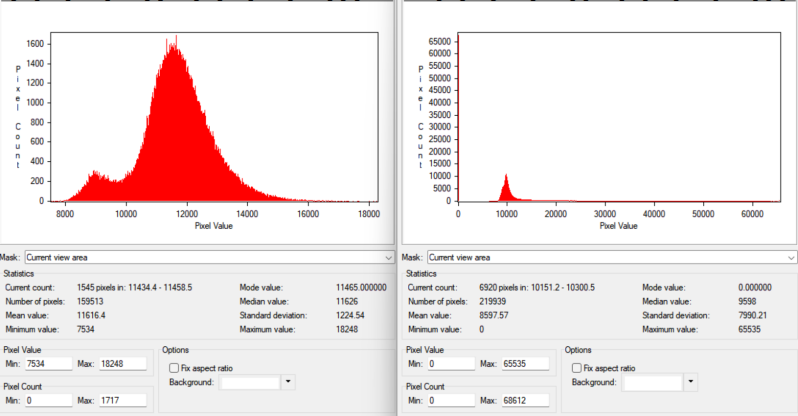
To show the levels of vegetation in this May 2025 scene, the Landsat 9 satellite uses the OLI-2 (Operational Land Imager) sensor. While this sensor works similarly to older ones, the technology is much more advanced. The most important tool for spotting the plants in the delta is Band 5 (Near-Infrared). Since healthy plants reflect a huge amount of Near-Infrared light, this band helps me see exactly where the "lush" areas are. The details of this data are stored in a 16-bit format, which allows for a huge range of values from 1 up to 65,535. Looking at the metadata, it is interesting to see that Bands 3, 4, 5, 6, and 7 all hit "saturation" in some areas. This means the landscape was so bright and the plants were so reflective that the sensor reached its maximum recording limit in those specific spots. To turn these raw numbers into information I can actually use, I have to apply the scaling factors from the metadata. For the light reflectance data, I use a multiplier of 0.0000275 and an addition of -0.2. The math for the temperature data is different, using a multiplier of about 0.0034 and an addition of 149.0. These formulas are necessary to convert the raw data into accurate readings of the ground conditions in the delta.
| Band Number | Band Name | Use in Mapping Lush Vegetation |
|---|---|---|
| Band 1 | Ultra Blue | Measures water vapor and helps detect smoke or haze. |
| Band 2 | Blue | Captures deep water and helps distinguish soil from plants. |
| Band 3 | Green | Highlights the visible greenness of the wetland canopy. |
| Band 4 | Red | Absorbed by chlorophyll; provides high contrast with plant health. |
| Band 5 | Near - IR (NIR) | Primary indicator of biomass and overall leaf health. |
| Band 6 | SWIR 1 | Shows moisture content in the soil amd vegetation. |
| Band 7 | SWIR 2 | Helpful for distinguishing between different types of minerals and rocks. |
| Band 10 | Thermal | Measures the heat of the canopy compared to bare ground |
Comparing the Images
| Statistic | 2019 (Landsat 8) | 2025 (Landsat 9) | Environmental Significance |
|---|---|---|---|
| Mode Value | 11,465 | 9,789 | The 2025 image has a lower most frequent value, showing a shift toward darker surface features. |
| Median Value | 11,626 | 10,041 | The middle value is lower in 2025, due to more water or moisture being present in the delta. |
| Maximum Value | 18,248 | 17,364 | 2025 has a lower deviation, meaning the pixel values are more tightly grouped than in 2019. |
| Standard Dev. | 1,224.54 | 1,093.72 | 2010 has much more variety due to clouds and shadows |
Create Your Own Website With Webador