Image 1: Okavango Delta May 25th, 2019
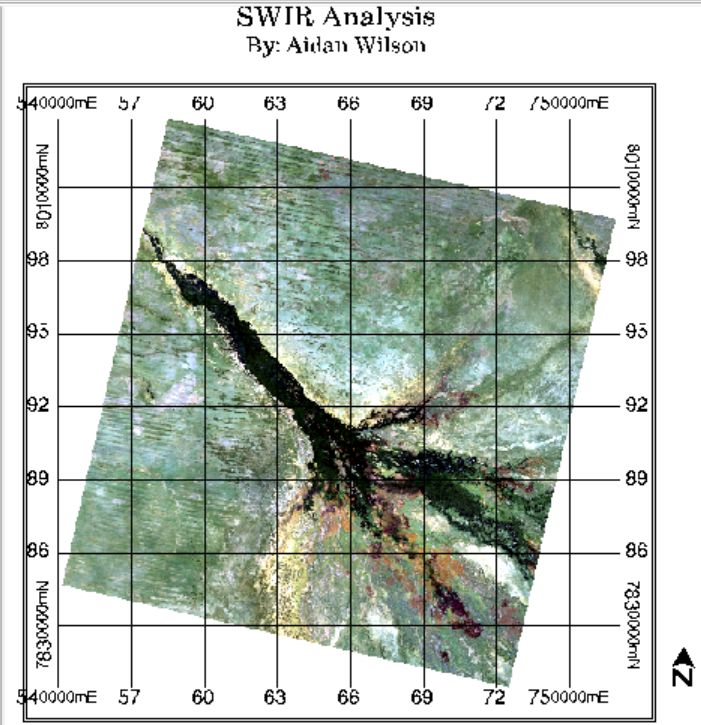
SWIR Analysis
This wide view shows how the huge, fan-shaped Okavango Delta spreads across the dry Kalahari desert. By using a 7-6-4 band mix—putting two types of infrared light (Short-wave Infrared 2 and 1) and red light into the colour guns, it creates what is known as a "Geology" image. To highlight the details, a "histogram equalization" tool was used to help see small features in dark, wet spots that might otherwise look like a flat blur. In this view, water paths look like dark green or black veins, making them stand out clearly against the desert. The sand and soil appear in shades of tan, which helps highlight the long, straight lines of old dunes. Finally, this colour mix makes burned land look like dark reddish-brown patches, showing where recent fires moved through the area.
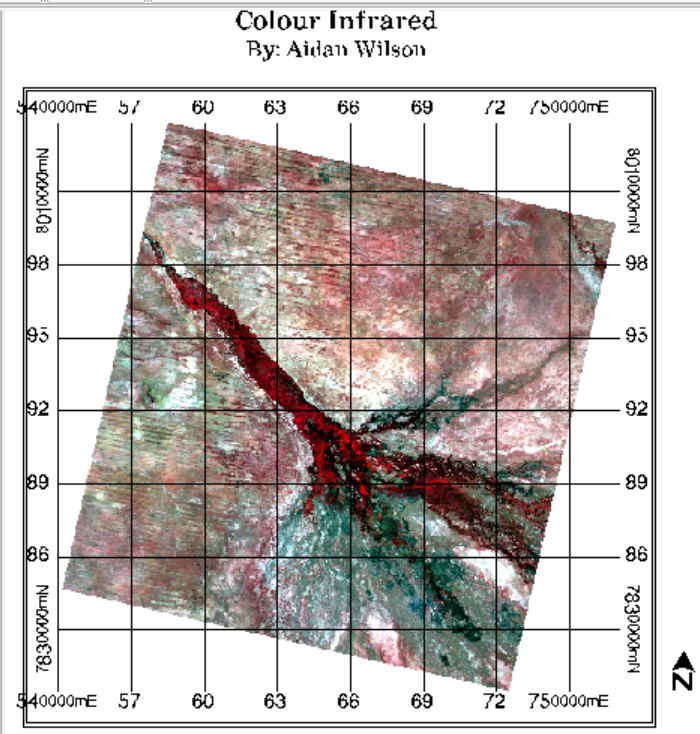
This second view focuses on the biological health of the delta using a classic "False Colour Infrared" representation. By assigning Band 5 (Near-Infrared), Band 4 (Red), and Band 3 (Green) to the red, green, and blue colour guns, we can see the landscape through the lens of vegetation productivity. To make these colours as clear as possible, a Linear 2% Stretch was applied to maximize colour saturation. This view is particularly effective because healthy plants reflect Near-Infrared light very strongly, causing the lush papyrus and grasses of the delta to glow in vibrant shades of red. This colour contrast allows us to easily tell the difference between different environments, where permanent swamps appear as deep reds and seasonal floodplains show up as lighter pinks. Additionally, the deep water in the main channels absorbs most light and appears nearly black, creating a sharp, high-contrast boundary against the surrounding red vegetation.
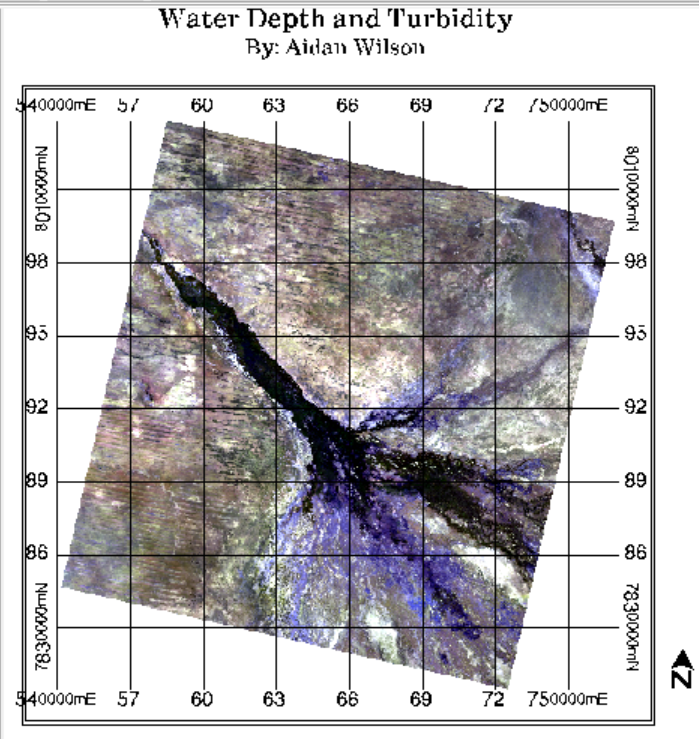
This view focuses on the underwater environment and soil moisture rather than just the surface plants. By assigning Band 4 (Red), Band 3 (Green), and Band 1 (Coastal Aerosol) to the color guns, we can look through the water's surface to see the terrain below. This combination is particularly interesting because Band 1 has a short wavelength that penetrates water much better than other bands. In this rendering, deep and clean water appears as dark or clear blue, while shallow areas or spots filled with silt and mud look like a cloudy, light cyan color. This allows us to map the "hidden" underwater channels of the delta that are usually hard to see. Furthermore, this view helps highlight moisture stress and soil wetness; by comparing these bands, we can tell the difference between bone-dry desert sand and soil that is soaked with life-giving water, even if there aren't many plants growing there yet.
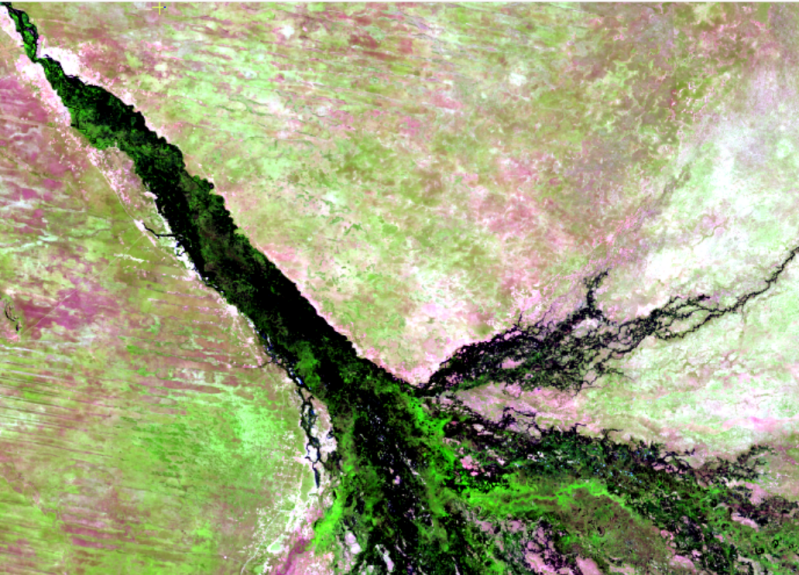
Image 2: Okavango Delta May 17th, 2025

This natural perspective uses a true-colour band combination to replicate exactly what an observer would see from an aircraft. By assigning Band 4 to the red gun, Band 3 to the green gun, and Band 2 to the blue gun, the image provides a realistic look at the landscape's physical features at a 1:100,000 scale. The photo is set to North Up, with the geographic center positioned near the 18°30'S, 22°00'E graticule, allowing for an accurate assessment of how human activity interacts with this complex ecosystem. The primary focus of this view is the relationship between human infrastructure and the natural environment. The map highlights the thin, linear grey and white traces of paved and unpaved roads that navigate the dry terrain on the very sides of the delta. These transit routes connect various clusters of settlements, such as the villages of Shakawe and Sepopa, which appear as tan and grey patches. These communities are strategically positioned on the stable, sandy Kalahari soils to avoid the unpredictable flooding of the delta. Bordering these areas, the legend distinguishes the vibrant life of the panhandle: dark green or black tones represent the permanent deep-water channels, while softer, muted greens identify the dense thickets of riparian vegetation and papyrus that thrive along the water's edge.
This perspective uses a 7-6-5 band combination to create an image. This setup is great because it helps see through thin clouds and clearly shows where the land is wet. By setting Band 7 (Shortwave Infrared 2) to red, Band 6 (Shortwave Infrared 1) to green, and Band 5 (Near-Infrared) to blue, the picture makes the geological and water features of the area stand out with a lot of detail. Viewed at a scale of 1:85,000 with North at the top, the image is centred near the middle of the alluvial fan. This provides a clear look at how the floodwaters spread out across the dry Kalahari Desert. The result is a high-contrast map that looks more natural than other combinations but is much more sensitive to water and plant health. In this view, healthy plants filled with water look vibrant green instead of red. This makes it easy to tell the difference between the growing delta and the dry land nearby. Meanwhile, the sandy desert soils show up in shades of tan and yellow, which helps highlight the different minerals in the sand. Water is very easy to spot because it absorbs infrared light, making the rivers and lagoons look like sharp, black ribbons or blue. This is a big help for monitoring the environment because it can pick up on tiny moisture differences in the soil that regular photos would miss.
What is most impressive about this 2025 data is how far south the floodwaters have moved. It is a huge change from the dry conditions seen in 2019. Back then, the drought was so bad that the water barely reached the middle of the delta before drying up. However, this May 2025 image shows the water pushing aggressively toward the southern edges. You can see the dark lines of the river extending way past the usual seasonal limits. The flood has already reached the Thamalakane River near Maun and is moving toward the Matlapaneng Bridge. This deep southern flow happened because of a strong La Niña cycle and heavy rains in the Angolan highlands, providing enough water to fill up the underground water levels that usually soak up the flood before it can get this far. This image illustrates why this area is crucial for biological and ecological studies. The massive amount of green we see in 2025 shows a healthy "flood pulse," which is basically the heartbeat of the delta. From space, we are looking at the start of the entire food web. When the water reaches the floodplains, it triggers the growth of plants that feed fish, birds, and vast herds of elephants and buffalo that travel long distances to find them. Because Landsat 9 is more advanced than older satellites, it captures these details with much better precision. This makes the image a vital piece of evidence showing how the delta can bounce back when there is plenty of water coming from the mountains.
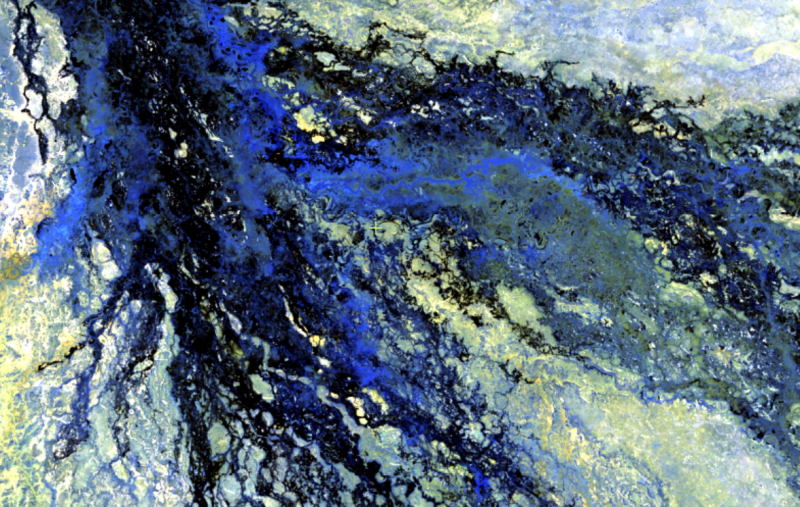
This view, titled Upper Panhandle: Aquatic and Riparian Interface, utilizes a 6-5-4 band combination to create a sharp distinction between the river's liquid core and its surrounding green walls. By assigning Band 6 (SWIR 1) to the red gun, Band 5 (NIR) to the green gun, and Band 4 (Red) to the blue gun, the image highlights the critical differences in moisture and chlorophyll density. This specific rendering is presented at a 1:40,000 scale to allow for a detailed examination of the meandering main channel before it begins to spill into the broad alluvial fan. The map is oriented North Up and is centered near 18°25'S, 21°50'E, capturing the narrow corridor where the Okavango River remains confined by stable banks.
The visual result is a high-contrast map that reveals the structural complexity of the riverbanks with exceptional clarity. In this rendering, the healthy, moisture-rich vegetation along the banks appears in a vivid, electric green, which contrasts beautifully with the river water itself. Because water almost entirely absorbs both Short-Wave Infrared and Near-Infrared light, the primary channels appear as smooth, obsidian-black ribbons carving through the landscape. This particular mix is unique because it effectively separates the "wet" riparian forest from the drier upland scrub, which appears in muted brown and olive tones. By emphasizing the moisture content of the soil and plants, this view makes the transition zones—where the water meets the land—pop with detail, showing the intricate network of smaller secondary channels and lagoons that sustain the local ecosystem.
Create Your Own Website With Webador